

Debug#
Configure Debug Options
NeoMutt can be built with a variety of different debugging options.
They enable code that might be useful to other developers.
Configure Option |
Description |
|---|---|
|
Enable backtrace support with libunwind |
|
Enable Color dump |
|
Enable Email dump |
|
Enable Graphviz dump |
|
Enable Key mappings dump |
|
Enable Debug logging |
|
Enable Name lookup tables |
|
Enable Notifications dump |
|
Enable TAILQ debugging |
|
Enable Windows dump |
These options are tested weekly by the Debug Action.
See also: Actions
Backtrace#
If you have libunwind installed, then NeoMutt can generate backtraces if it
crashes or exits abnormally. The output is also logged to .neomuttdebug0
This is useful, but no substitute for ASAN.
# Enable backtrace support with libunwind
./configure --debug-backtrace
The output might look like this:
NeoMutt 20230517-195-e79e91-dirty
Backtrace
    curses_segv_handler() ip = 25, sp = 7ffd889bb740
    op_print() ip = 41, sp = 7ffd889bc4d0
    index_function_dispatcher() ip = 14f, sp = 7ffd889bc520
    dlg_index() ip = bf3, sp = 7ffd889bc590
    main() ip = 2816, sp = 7ffd889bca30

Segmentation fault (core dumped)
Color#
The colours are stored in lots of global variables.
# Enable Color dump
./configure --debug-color
Enabling this option exposes a suite of functions to dump the colours to the log.
Where possible, ANSI escape sequence will be logged so that cating the log will show the correct colours.
attr_color_list_dump()curses_colors_dump()merged_colors_dump()and many more
It also defines a color_debug() function that works like mutt_debug().
Note: The functions are all conditionally defined. There’s no need for #ifdef USE_DEBUG_COLOR around them.
Email#
Sometimes a quick dump is all you need.
# Enable Email dump
./configure --debug-email
This exposes a some functions to dump the contents of an Email.
dump_email()dump_body()dump_envelope()…
The output looks like this:
Email
    path: cur/1656086025.R18315247289739240151.flatcap:2,S
    Flags: display_subject,mime,old,read,recip_valid,subject_changed,threaded,visible
    Security: [NONE]
    Sent: Tue, 16 Jul 2019 11:29:41 UTC (+0100)
    Recv: Tue, 16 Jul 2019 11:29:41 UTC
    num_hidden: 0
    recipient: 4
    offset: 0
    lines: 0
    index: 1106
    msgno: 1094
    vnum: 1094
    score: 0
    attach_total: 0
Graphviz#
Often when debugging, it’s hard to visualise how object fit together. Graphviz can help by generating live diagrams.
# Enable Graphviz dump
./configure --debug-graphviz
When enabled, it exposes four functions to dump various objects and their children:
dump_graphviz()- Dump aMailboxViewdump_graphviz_attach_ctx()- Dump anAttachCtxdump_graphviz_body()- Dump theBodyof anEmaildump_graphviz_email()- Dump an entireEmail
The code in debug/graphviz.c contains a number of defines that control the display, e.g. GV_HIDE_ADATA
#include "debug/lib.h"

// ...
dump_graphviz("title", mv);
It will create a dated file in the current directory, e.g. 17\:42\:05-title.gv
The ImageMagick package has a display program that can view .gv files directly.
Alternatively, you can use GraphViz’s dot program to convert it to an image:
dot -Tpng file.gv > file.png
The output can look like this:
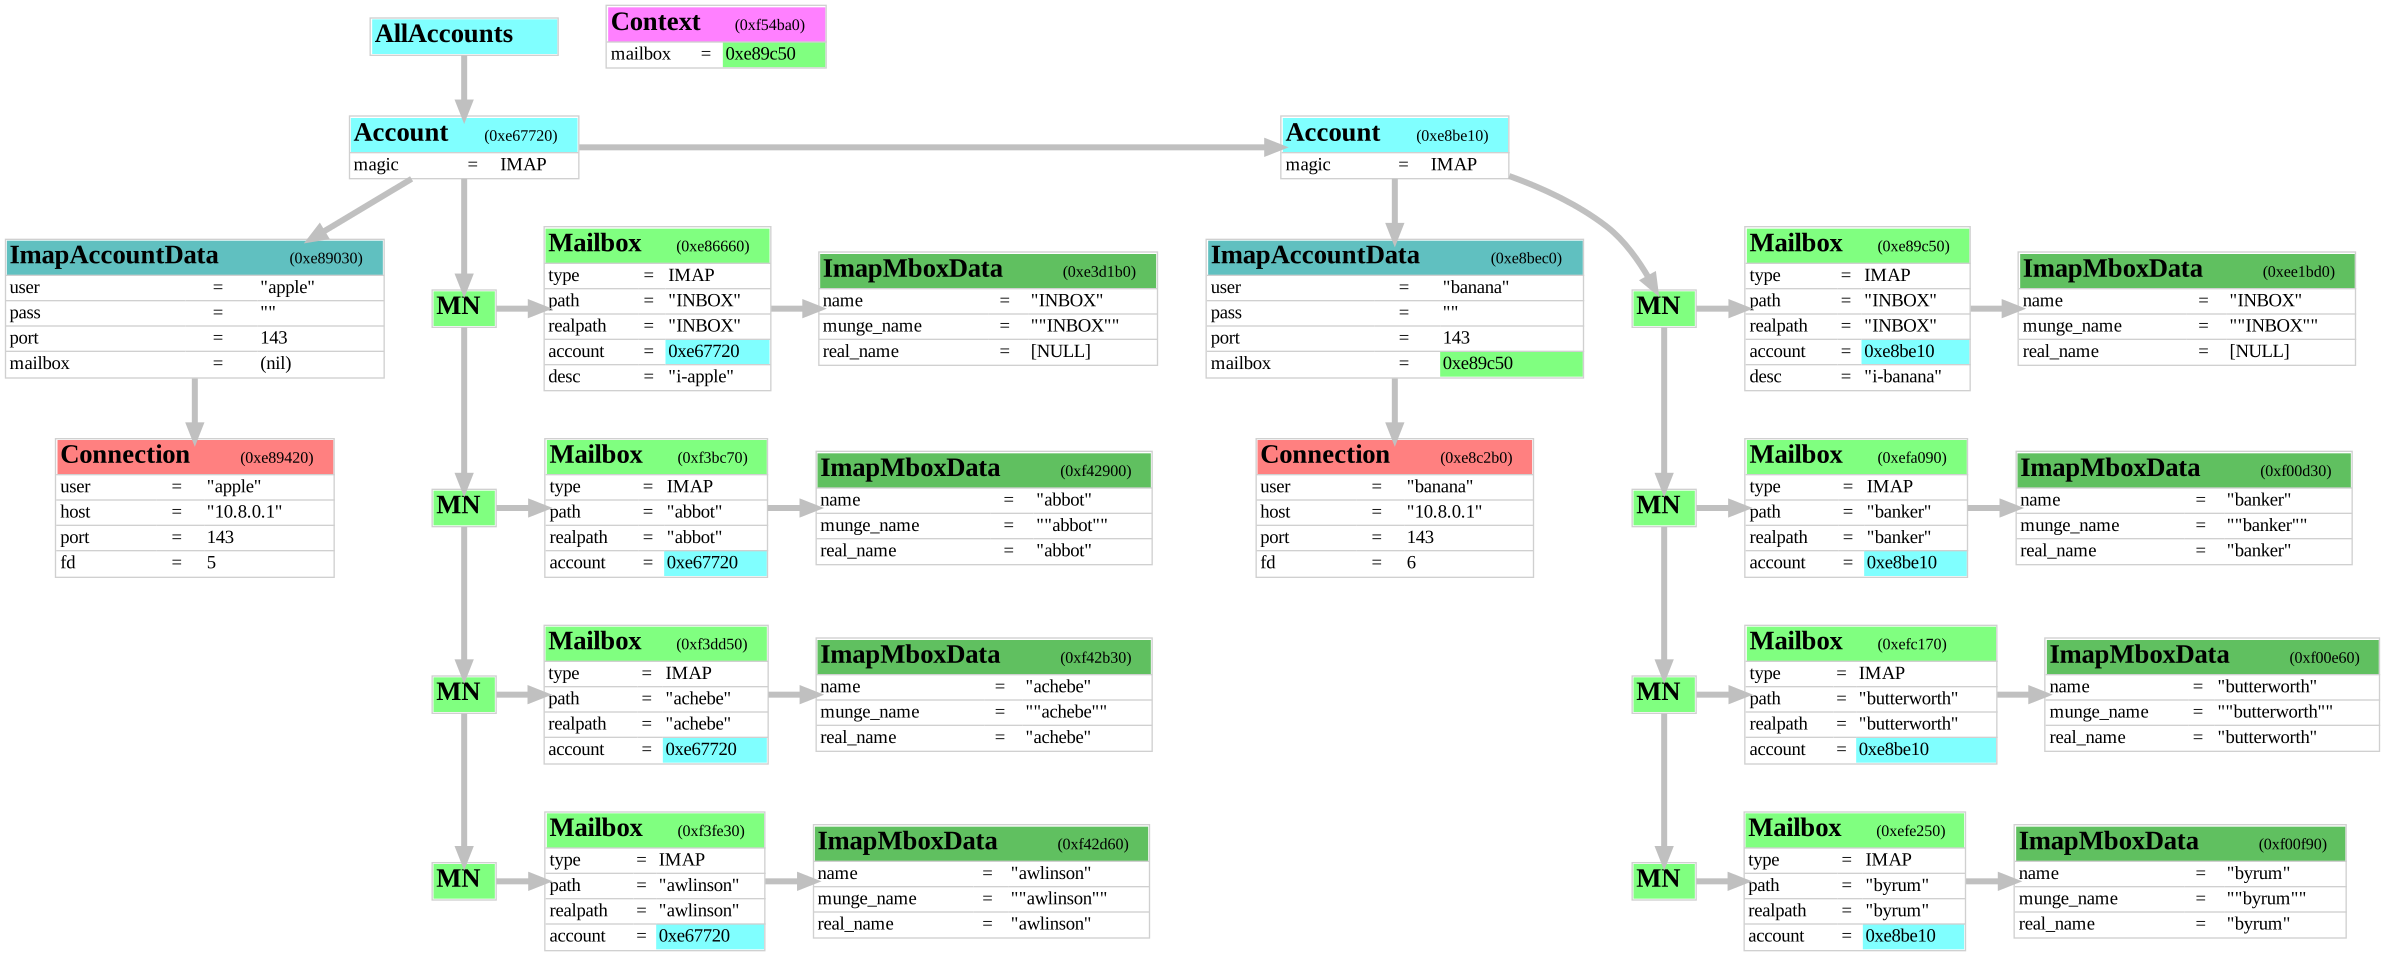
Note: The pointer values are real!
Keymap#
Keybindings are stored in a tree. This option enables functions for logging the keybindings.
Enable Key mappings dump
./configure --debug-keymap
Logging#
Add a Logging Dispatcher that dumps everything to stdout.
Enable Debug logging
./configure --debug-logging
Names#
When debugging, it’s often useful to display the symbolic name rather than just 42.
# Enable Name lookup tables
./configure --debug-names
Enabling this option exposes functions to name various types, e.g.
name_menu_type()forenum MenuTypename_notify_mailbox()forenum NotifyMailbox
More types are welcome.
Notify#
More and more of NeoMutt is driven by notifications. Keeping track of them can be hard.
# Enable Notifications dump
./configure --debug-notify
When enabled, NeoMutt creates an observer on the NeoMutt object that dumps every notification.
It tries to dump as much information as it can, e.g.
Notification: NT_INDEX
    Event Type: 13
    Event Sub-type: 64
    Event Data: 0x1dad1c0
    Global Data: (nil)
Queue#
The Linux and BSD kernels share an implementation of List and Queue types. NeoMutt has adopted it too.
It’s very powerful, but quite hard to understand.
# Enable TAILQ debugging
./configure --debug-queue
Enabling this option turns on debugging in the List/Queue macros. When they change, the objects will store their old state and the address of the code that changed them.
Window#
NeoMutt’s windows are actually a tree of nested windows.
The gfx repo has lots of diagrams.
# Enable windows dump
./configure --debug-window
When enabled, NeoMutt will dump the state of all the windows to the log.
Using tail, you can watch the output live.
tail -F ~/.neomuttdebug0 | sed 's/.*\]<.> [a-z0-9_]\+() //'
The output shows:
Whether it’s visible
✓or not✗It’s absolute screen position,
[20,11]The size of the window: fixed, maximise, minimise
Whether it expands horizontally, or vertically
The type, e.g.
WT_HELP_BARThe window’s size
(75,10)And which is focused,
<-- FOCUS
✓[0,0] MUTT_WIN_SIZE_FIXED-V WT_ROOT (95,22)
    ✗[0,0] MUTT_WIN_SIZE_FIXED-V WT_HELP_BAR (95,1)
    ✓[0,0] MUTT_WIN_SIZE_MAXIMISE-V WT_ALL_DIALOGS (95,21)
        ✓[0,0] MUTT_WIN_SIZE_MAXIMISE-H WT_DLG_INDEX (95,21)
            ✓[0,0] MUTT_WIN_SIZE_FIXED-H WT_SIDEBAR (20,21)
            ✓[20,0] MUTT_WIN_SIZE_MAXIMISE-V WT_CONTAINER (75,21)
                ✓[20,0] MUTT_WIN_SIZE_MINIMISE-V WT_INDEX (75,11)
                    ✓[20,0] MUTT_WIN_SIZE_FIXED-V WT_MENU (75,10)
                    ✓[20,10] MUTT_WIN_SIZE_FIXED-V WT_STATUS_BAR (75,1)
                ✓[20,11] MUTT_WIN_SIZE_MAXIMISE-V WT_PAGER (75,10)
                    ✓[20,11] MUTT_WIN_SIZE_MAXIMISE-V WT_CUSTOM (75,9) <-- FOCUS
                    ✓[20,20] MUTT_WIN_SIZE_FIXED-V WT_STATUS_BAR (75,1)
    ✓[0,21] MUTT_WIN_SIZE_MINIMISE-V WT_CONTAINER (95,1)
        ✓[0,21] MUTT_WIN_SIZE_FIXED-V WT_MESSAGE (95,1)